Troubleshooting Linux systems traditionally involves a familiar dance: run a command, copy the output, paste it into a chat with an AI assistant, wait for suggestions, repeat. The linux-mcp-server changes this paradigm entirely. Instead of being a passive advisor, your AI assistant becomes an active participant that can directly query your systems, correlate information across multiple data sources, and provide contextual analysis in real-time.

What is MCP?
The Model Context Protocol (MCP) is an open standard introduced by Anthropic in November 2024. It defines how AI models can interact with external tools and data sources in a structured, secure way. Think of it as a standardized API that lets AI assistants reach beyond their training data to access live information.
MCP servers expose specific capabilities - tools that the AI can invoke when needed. The AI decides when and how to use these tools based on the conversation context, making interactions feel natural rather than scripted.
Enter linux-mcp-server
The linux-mcp-server is a Red Hat project that implements MCP for Linux system administration. It provides read-only diagnostic tools covering:
- System information: OS details, CPU, memory, disk usage, hardware specs
- Service management: systemd service status, logs, and configuration
- Process monitoring: Running processes with resource metrics
- Log analysis: Journal queries, audit logs, application logs
- Network diagnostics: Interfaces, connections, listening ports
- Storage analysis: Block devices, mount points, directory listings
The key design principle is safety: all operations are read-only. The server can inspect your system but cannot modify it, making it safe to use even on production systems.
Installation
The server requires Python 3.10+ and can be installed several ways:
# Via pip
pip install linux-mcp-server

# Via uv (recommended for isolation)
uv tool install linux-mcp-server

# Or run directly without installing
uvx linux-mcp-server
For Claude Desktop or Claude Code integration, add it to your MCP configuration:
{
  "mcpServers": {
    "linux-mcp-server": {
      "command": "uvx",
      "args": ["linux-mcp-server"]
    }
  }
}
Local and Remote Systems
One of the most powerful features is transparent SSH support. Every tool accepts an optional host parameter. Without it, commands run locally. With it, they execute on the remote system via SSH:
# Query local system
get_system_info()

# Query remote system
get_system_info(host="webserver.example.com")
SSH authentication uses key-based auth exclusively (no passwords), reading keys from ~/.ssh/ or a path specified via LINUX_MCP_SSH_KEY_PATH. Your existing ~/.ssh/config is respected, so per-host usernames, ports, and jump hosts work automatically.
Real-World Example: Diagnosing a Remote Server
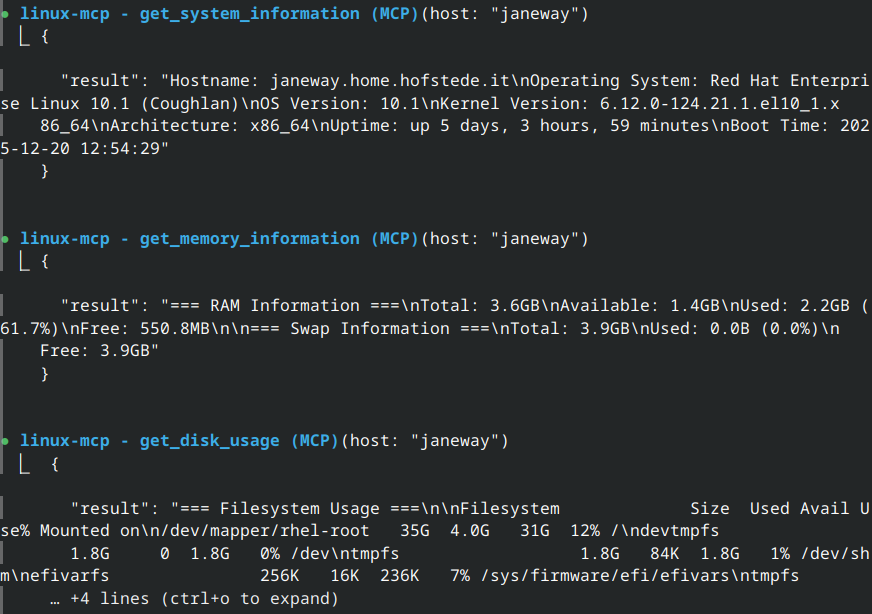
Here’s where things get interesting. Instead of explaining what the tools do, let me demonstrate by querying a real system. The following analysis was performed live on a server named “janeway”:
System Overview
When I ask the AI to check the system, it queries the server directly:
“What can you tell me about the janeway server?”
Hostname: janeway.home.hofstede.it
Operating System: Red Hat Enterprise Linux 10.1 (Coughlan)
Kernel Version: 6.12.0-124.21.1.el10_1.x86_64
Architecture: x86_64
Uptime: up 5 days, 3 hours, 59 minutes
Boot Time: 2025-12-20 12:54:29

CPU Model: Intel(R) Core(TM) i7-8550U CPU @ 1.80GHz
CPU Cores: 2 logical (1 physical)
Load Average: 0.37, 0.22, 0.13
This is a RHEL 10.1 VM running on a Proxmox host, with modest resources allocated for its workload. The AI can immediately see this is a stable system - low load averages and over 5 days of uptime.
Service Health Check
“Is the Omada controller running properly?”
The server runs a TP-Link Omada network controller as a Podman container managed through systemd Quadlets:
● omada-controller.service - TP-Link Omada Controller (Podman Quadlet)
     Loaded: loaded (/etc/containers/systemd/omada-controller.container; generated)
     Active: active (running) since Sat 2025-12-20 12:54:56 CET; 5 days ago
   Main PID: 1398 (conmon)
      Tasks: 317 (limit: 22891)
     Memory: 2.1G (peak: 2.1G)
        CPU: 8h 6min 41.871s
     CGroup: /system.slice/omada-controller.service
             ├─libpod-payload-6cbbd984675b...
             │ ├─1413 java -server -Xms128m -Xmx1024m ...
             │ ├─1811 mongod --port 27217 --dbpath ../data/db ...
The AI correlates multiple data points: the service is active, has been running since boot (matching the system uptime), and is using about 2.1GB of memory for its Java process and embedded MongoDB. It can also see recent log entries showing normal operation - firmware checks running on schedule, topology updates proceeding without errors.
Resource Analysis
“How are resources looking? Any concerns?”
=== RAM Information ===
Total: 3.6GB
Available: 1.4GB
Used: 2.2GB (61.7%)
Free: 550.8MB

=== Swap Information ===
Total: 3.9GB
Used: 0.0B (0.0%)
Free: 3.9GB

=== Filesystem Usage ===
Filesystem             Size  Used Avail Use% Mounted on
/dev/mapper/rhel-root   35G  4.0G   31G  12% /
/dev/vda2              960M  448M  513M  47% /boot
The AI provides contextual analysis: “Memory usage at 62% is healthy for a server running a Java application with MongoDB. The fact that swap is completely unused indicates no memory pressure - the system has headroom. Disk usage at 12% on root is excellent, though /boot at 47% might warrant attention during future kernel updates.”
This kind of interpretation is where the conversational approach shines. The raw numbers are available, but the AI adds the “so what” that helps you understand whether action is needed.
Network Visibility
“What services are exposed on this machine?”
=== Listening Ports ===
tcp  LISTEN  0.0.0.0:22     SSH
tcp  LISTEN  0.0.0.0:111    rpcbind
tcp  LISTEN  0.0.0.0:8043   Omada Controller (HTTPS management)
tcp  LISTEN  0.0.0.0:8088   Omada Controller (HTTP redirect)
tcp  LISTEN  0.0.0.0:8843   Omada Controller (HTTPS portal)
tcp  LISTEN  0.0.0.0:29810-29814  Omada device communication
udp  UNCONN  0.0.0.0:29810  Omada device discovery
The AI maps the ports to their purposes: “This is a dedicated Omada controller. SSH is available for administration. The Omada-specific ports (8043, 8088, 8843, 29810-29814) are for the controller’s web interface and communication with managed network devices. I also notice port 111 (rpcbind) is listening - this is typically for NFS support. If NFS isn’t actively used, consider whether this service needs to be running.”
The Conversational Advantage
The real power isn’t in individual commands - it’s in the conversation. Consider this exchange:
User: “My web server seems slow. Can you check what’s going on?”
The AI assistant can now:
- Query system load and memory pressure
- Check if the web server service is running properly
- Examine recent logs for errors
- Look at network connections and listening ports
- Correlate all this information and provide a coherent diagnosis
All without the user needing to know which specific commands to run or how to interpret the raw output. The assistant contextualizes numbers that might be meaningless to a casual user: “Memory usage is at 89%, which is high but not critical. However, I notice significant swap activity which could explain the perceived slowness.”
Security Considerations
The linux-mcp-server takes a defense-in-depth approach:
- Read-only operations: No tool can modify system state
- Predefined tools only: Arbitrary command execution is not possible
- Log path allowlisting: Only explicitly permitted log files can be read (controlled via
LINUX_MCP_ALLOWED_LOG_PATHS) - Parameter validation: Inputs are sanitized to prevent injection attacks
- Audit logging: All operations are logged for accountability
For remote access, standard SSH security applies. The server uses your existing SSH configuration and key-based authentication, inheriting whatever access controls you’ve already established.
Configuration Options
Environment variables control server behavior:
| Variable | Purpose |
|---|---|
LINUX_MCP_ALLOWED_LOG_PATHS |
Comma-separated list of accessible log file paths |
LINUX_MCP_LOG_LEVEL |
Logging verbosity (DEBUG, INFO, WARNING, ERROR) |
LINUX_MCP_SSH_KEY_PATH |
Path to SSH private key for remote connections |
LINUX_MCP_USER |
Default SSH username for remote connections |
Available Tools
The server exposes these diagnostic capabilities:
| Tool | Description |
|---|---|
get_system_information |
OS version, kernel, hostname, uptime |
get_cpu_information |
CPU model, cores, current load |
get_memory_information |
RAM usage, swap, available memory |
get_disk_usage |
Filesystem usage, mount points |
get_hardware_information |
PCI/USB devices, DMI data |
list_services |
All systemd services and their states |
get_service_status |
Detailed status of a specific service |
get_service_logs |
Journal entries for a service |
list_processes |
Running processes with resource usage |
get_process_info |
Detailed info about a specific PID |
get_network_interfaces |
Network interfaces and addresses |
get_network_connections |
Active network connections |
get_listening_ports |
Services listening on ports |
get_journal_logs |
Systemd journal queries |
get_audit_logs |
Security audit log entries |
read_log_file |
Read from allowlisted log files |
list_block_devices |
Disk and partition information |
list_files / list_directories |
Directory contents with metadata |
Use Cases
Beyond ad-hoc troubleshooting, the linux-mcp-server enables:
Pre-upgrade assessment: “Check if this server is ready for a major OS upgrade” - the AI can examine repositories, disk space, running services, and potential compatibility issues.
Capacity planning: “Analyze resource usage trends” - correlate CPU, memory, and disk metrics to identify bottlenecks before they become problems.
Security auditing: “Review what services are exposed to the network” - examine listening ports, running services, and their configurations.
Documentation: “Summarize this server’s configuration” - generate human-readable descriptions of system setup for documentation purposes.
Limitations
The current implementation has intentional constraints:
- No write operations: You can’t restart services, edit files, or make changes through the MCP server
- RHEL/systemd focus: Optimized for Red Hat-based distributions; some tools may not work on non-systemd systems
- Smaller models need verification: While Claude and other large models provide reliable guidance, smaller open-source models may produce suggestions that require verification
Getting Started
- Install the server:
pip install linux-mcp-serveroruv tool install linux-mcp-server - Configure your AI client (Claude Desktop, Claude Code, or another MCP-compatible client)
- Start asking questions about your systems
The barrier to entry is remarkably low. If you can SSH to a machine, the linux-mcp-server can query it.
Conclusion
The linux-mcp-server represents a meaningful shift in how we interact with systems. Instead of the AI being a sophisticated search engine that helps you find the right commands, it becomes a collaborative partner that can actually see your system’s state.
This isn’t about replacing sysadmin knowledge - you still need to understand what the AI is telling you and make informed decisions. But it dramatically lowers the friction of system diagnostics, especially for:
- Developers who occasionally need to debug production issues
- Junior administrators learning the ropes
- Anyone managing systems outside their primary expertise
- Experienced admins who want faster initial triage
The project is open source and actively developed. Contributions for additional diagnostic tools, support for other distributions, and integration with documentation via RAG are welcome.
References
- linux-mcp-server on GitHub
- Fedora Magazine: Find out how your Fedora system really feels
- Model Context Protocol specification
- Anthropic’s MCP announcement
Thanks to the Red Hat and Fedora teams for developing linux-mcp-server and making AI-assisted system administration a reality. The future of troubleshooting is conversational.
